

📊 03. TCO Cost Analysis & Insights (TCO Analysis)
Uncover hidden expenses beneath the surface and reveal your true ownership bill.
Many buyers assume “car costs = fuel + oil changes”, only to discover substantial financial losses when selling years later. This guide dissects every core analytical card in TrueCostAuto’s comprehensive report.
📑 In This Guide
- TCO Core Dashboard and Four Key Metrics
- Annual Operating Costs: Energy, Insurance, Maintenance, and Tolls
- Asset Depreciation & Residual Value Actuarial Modeling
- Initial Acquisition & On-Road Startup Costs
- Opportunity Cost of Capital & Financing Interest
- Real-World Consumption & Efficiency Analysis
- Subjective Trade-offs & Annual Expenditure Breakdown
- 5-Dimensional Health Radar & Optimal Replacement Timing
1. TCO Core Dashboard and Four Key Metrics
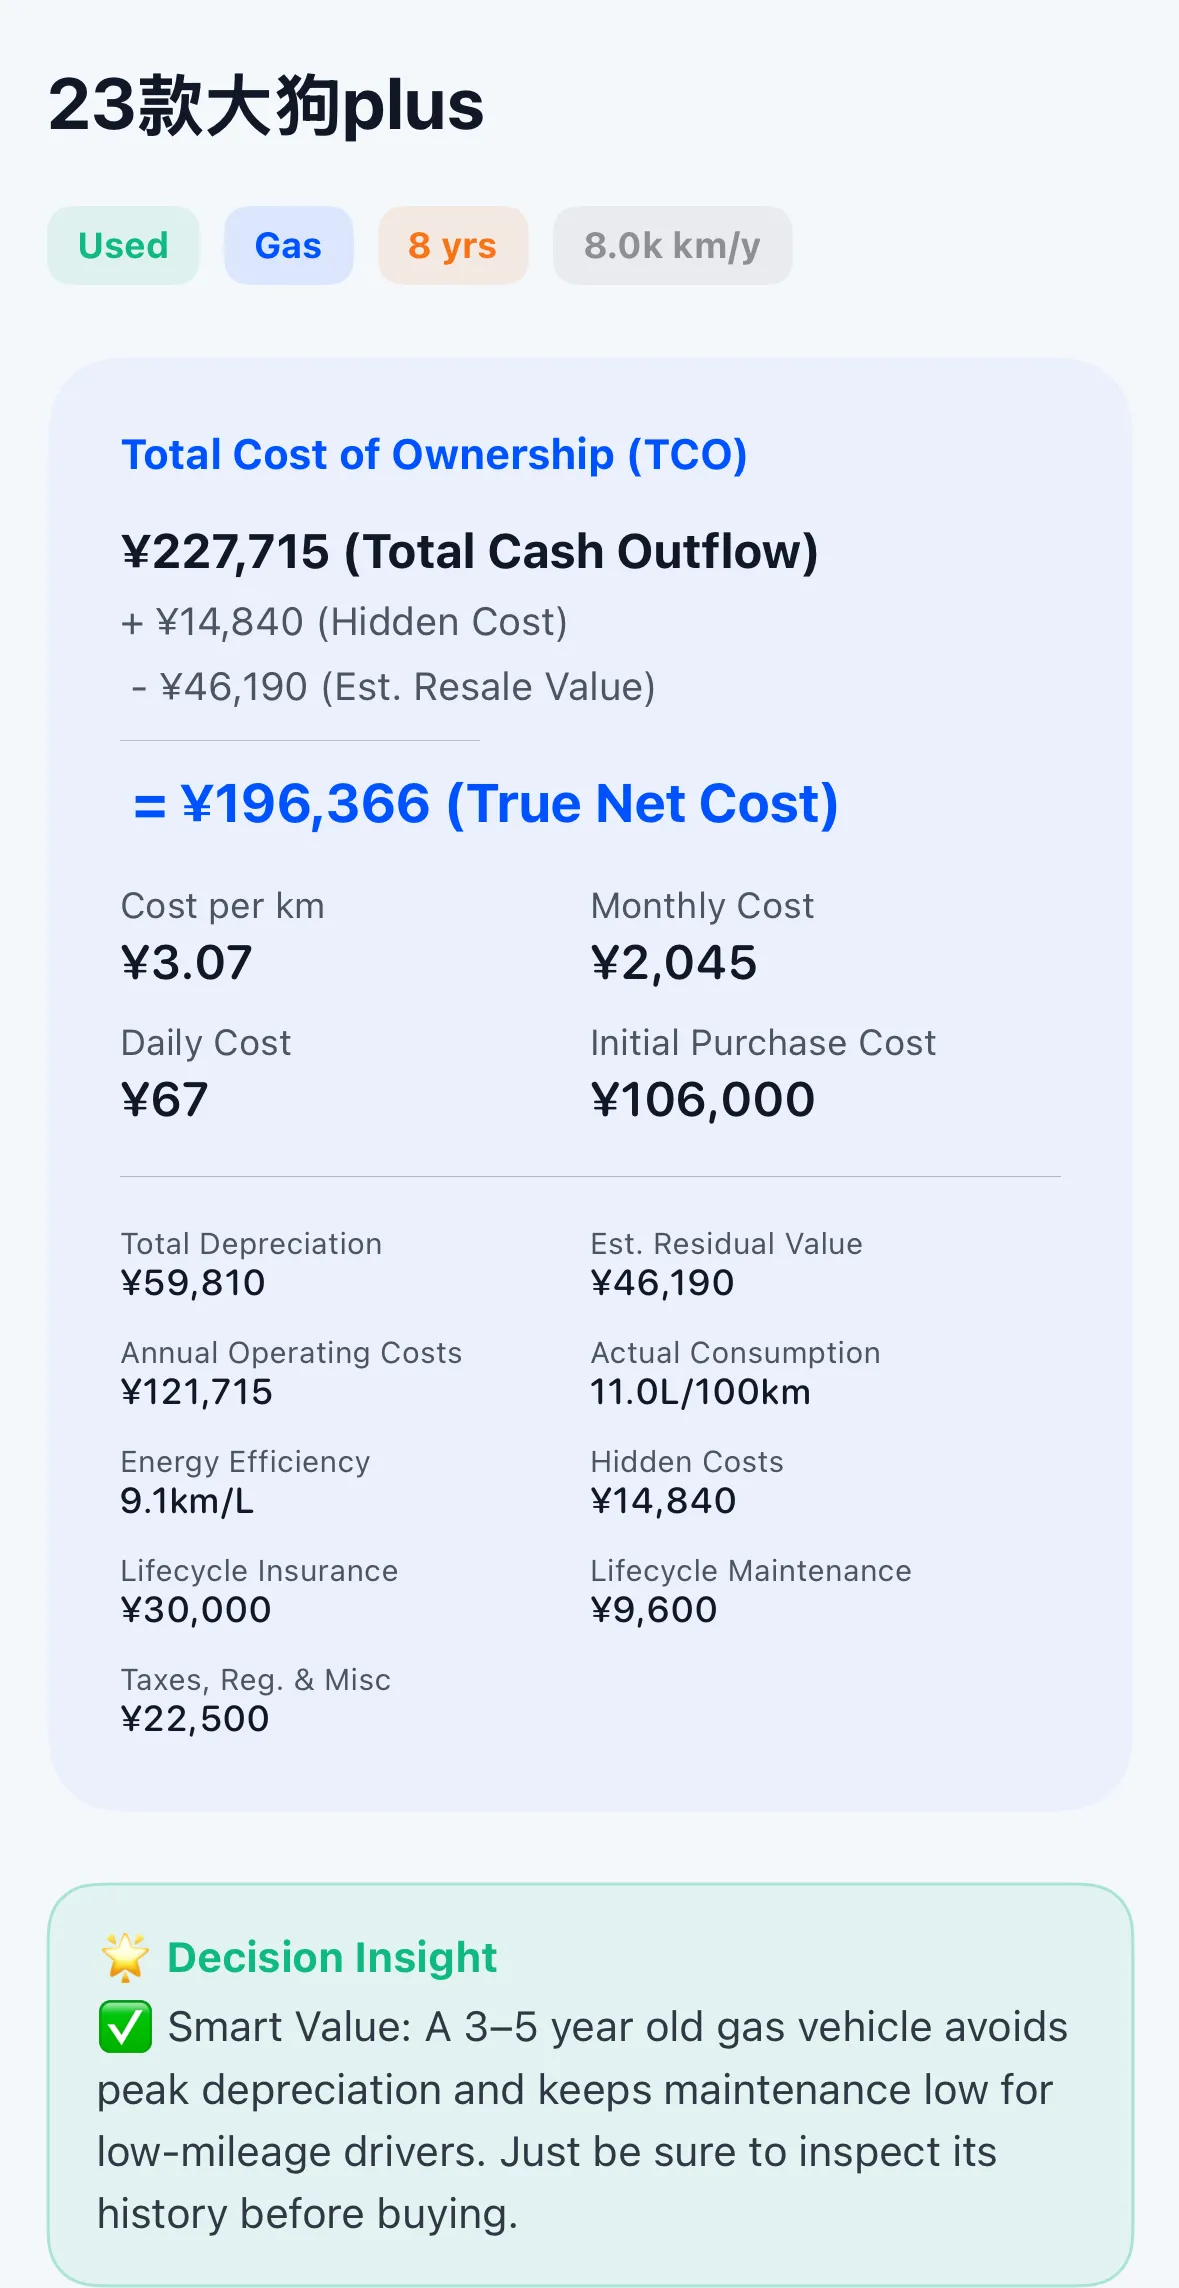
At the top of the vehicle details screen sits the primary dashboard: Total Cost of Ownership (TCO). TrueCostAuto replaces superficial single-item additions with modern financial True Net Cost accounting:
1.1 Core Actuarial Formula (Four-Step Closed Loop)
On the main TCO card, the system reconciles cash flows and terminal asset value to calculate the True Net Cost of owning the vehicle:
- Total Cash Outflow: Cumulative real cash spent over the ownership horizon (on-road purchase price, energy/fuel, insurance, routine maintenance, taxes, and tolls);
- + Hidden Financing Cost: Lost interest yields resulting from capital tied up in vehicle equity (opportunity cost), or cumulative financing interest paid on auto loans;
- - Estimated Resale Value: Expected fair market cash recovery returned to you when selling the car at the end of the period;
- = True Net Cost: The actual financial wealth consumed by the vehicle across the designated holding period.
1.2 Four Tangible Metrics and 9-Item Grid
Below the total figure, expenses are amortized across four intuitive temporal dimensions:
- Cost per km / mile: e.g.,
$0.45/mi(¥3.07/km), the comprehensive cost of every drive; - Monthly Cost: e.g.,
$450/month(¥2,045/month), evaluated against household monthly salary and cash flow; - Daily Cost: e.g.,
$15/day(¥67/day), the daily burn rate of having the car parked downstairs; - Initial Purchase Cost: e.g.,
$28,500(¥106,000), total cash required to drive the car off the dealer lot.
The lower half displays a structured 9-item grid (cumulative depreciation, projected residual value, annual operating budget, real-world consumption, lifetime insurance & service), accompanied by automated Decision Insights tailored to the model.
2. Annual Operating Costs: Energy, Insurance, Maintenance, and Tolls
These represent recurring cash expenses required to keep the car running day-to-day:
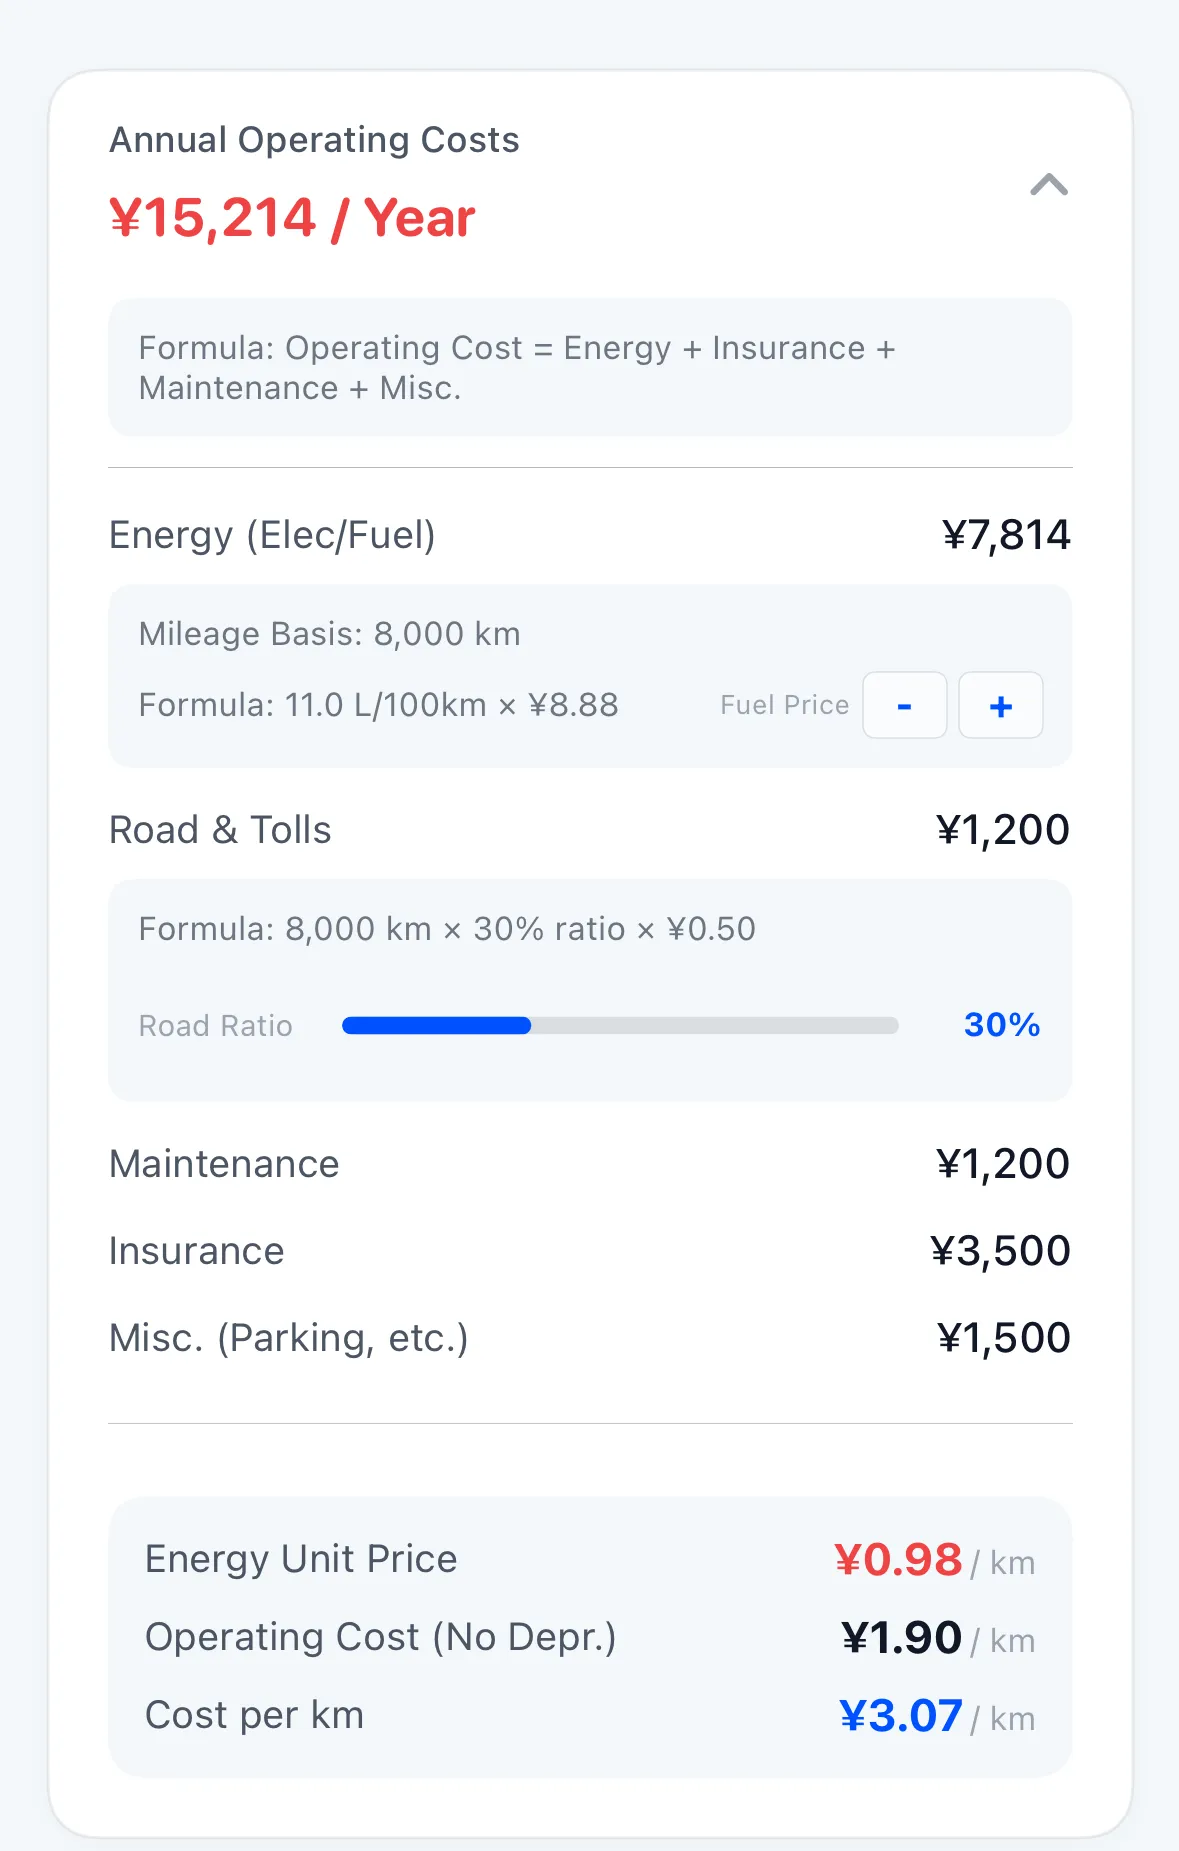
- Energy / Fuel: Calculated strictly from vehicle consumption, annual mileage, and prevailing pump/kWh rates;
- Road & Highway Tolls: Estimated using your designated highway driving ratio and benchmark toll rates;
- Scheduled Maintenance: Oil services, brake pads, fluids, filters, and standard wear items;
- Subsequent Insurance: Annual premiums factoring in no-claim discount curves over time;
- Parking & Miscellaneous: Garage rental, meter parking, and washing;
- Immediate Unit Breakdown: The card outputs Energy Unit Cost ($/mi or ¥/km) alongside pure operating cost excluding depreciation.
3. Asset Depreciation & Residual Value Actuarial Modeling
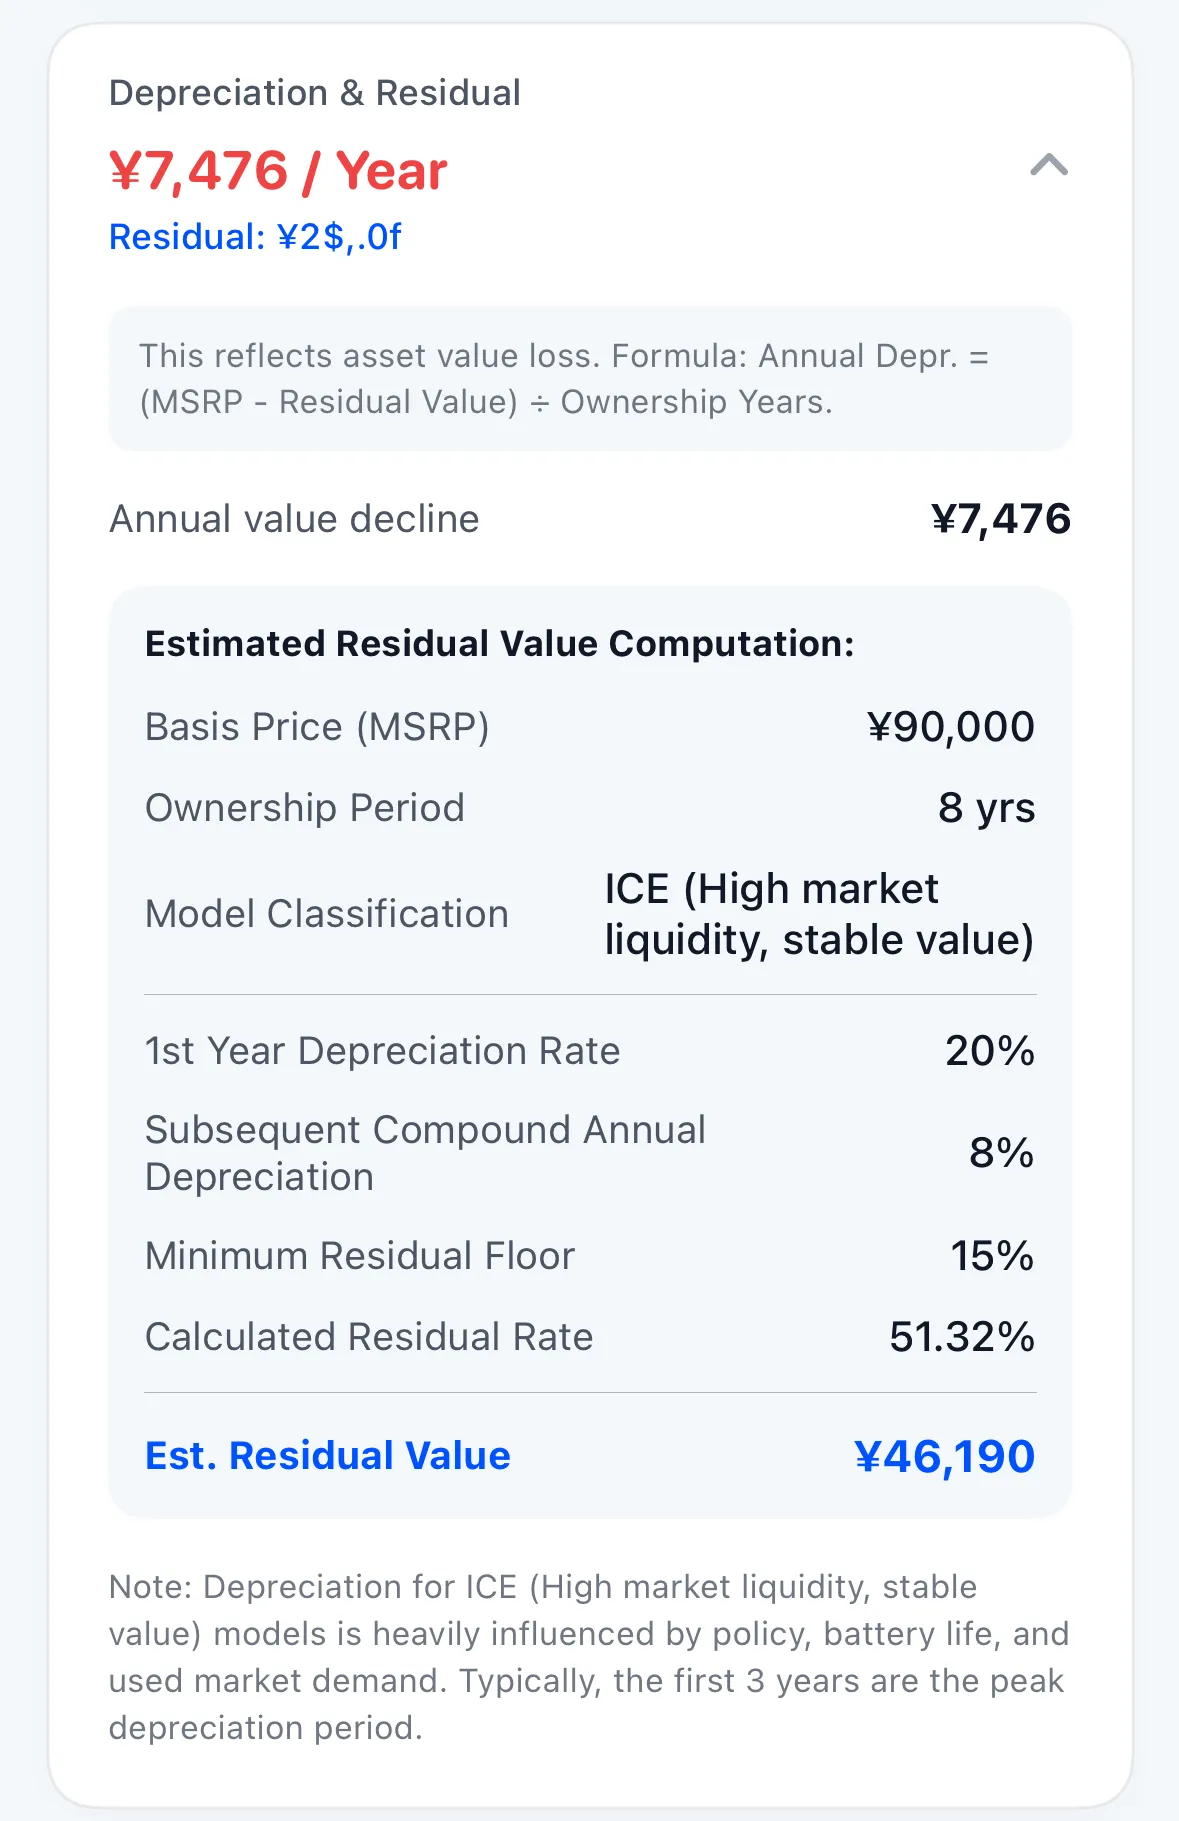
Depreciation is typically the single largest expense in passenger vehicles, accounting for 40% to 65% of lifetime costs, yet it is frequently overlooked because it does not require a monthly out-of-pocket check.
3.1 Actuarial Depreciation Progression
- First-Year Depreciation Rate: Vehicles enter the used market immediately upon delivery, suffering their steepest loss (typically 15%–25%);
- Subsequent Compound Depreciation: From Year 2 onward, losses follow an exponential decay curve (e.g., compounding downward at 8% annually);
- Minimum Residual Floor: Based on historical salvage and scrap auction data, establishing a realistic floor (e.g., 15%) so residual value never drops artificially to zero;
- Dynamic Projected Valuation: The system dynamically derives the Residual Retention Percentage and Estimated Resale Cash Value after years.
4. Initial Acquisition & On-Road Startup Costs
Driving a car home involves statutory fees and registration requirements beyond the agreed vehicle price:
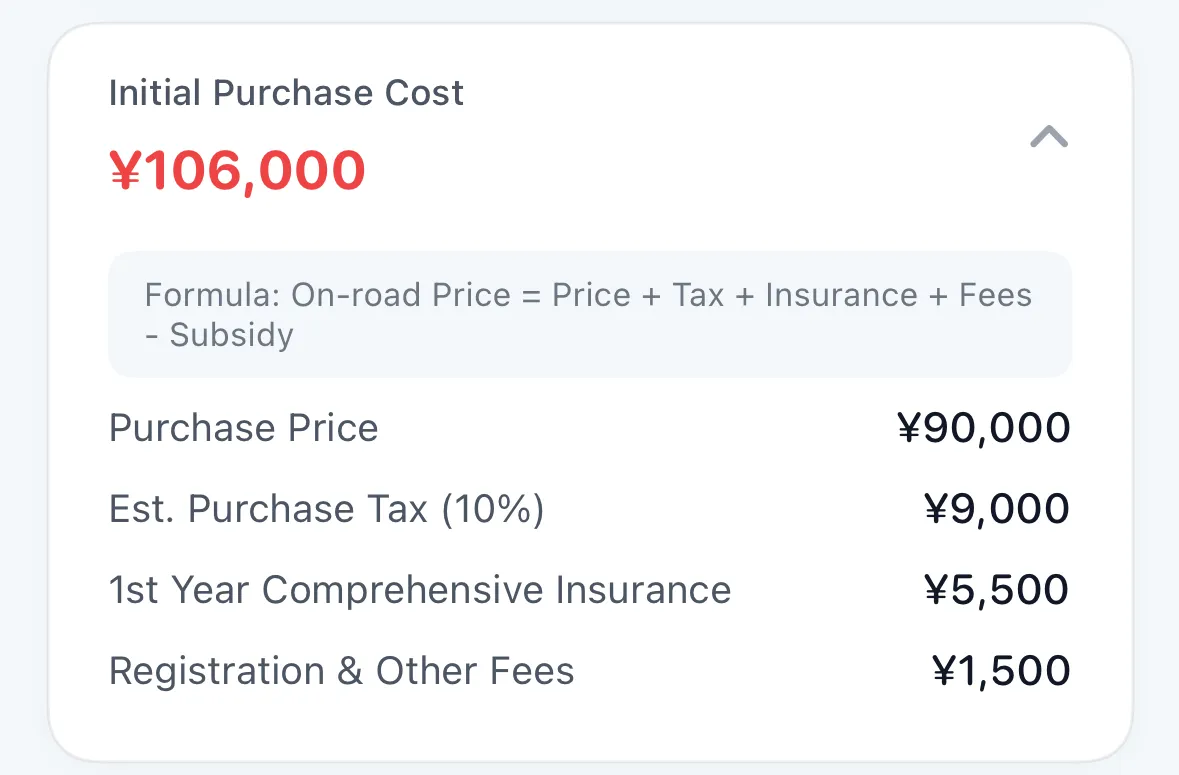
- Vehicle Agreed Price: Official negotiated bill of sale amount;
- Purchase / Sales Tax: Standard regional statutory vehicle purchase tax (with EV exemptions applied where valid);
- First-Year Comprehensive Insurance: Initial insurance policy issued prior to vehicle delivery;
- Registration & Dealer Documentation: Inspection fees, state/provincial registration, and documentation charges.
5. Opportunity Cost of Capital & Financing Interest
Capital possesses time value, forming a cornerstone of professional financial decision-making:
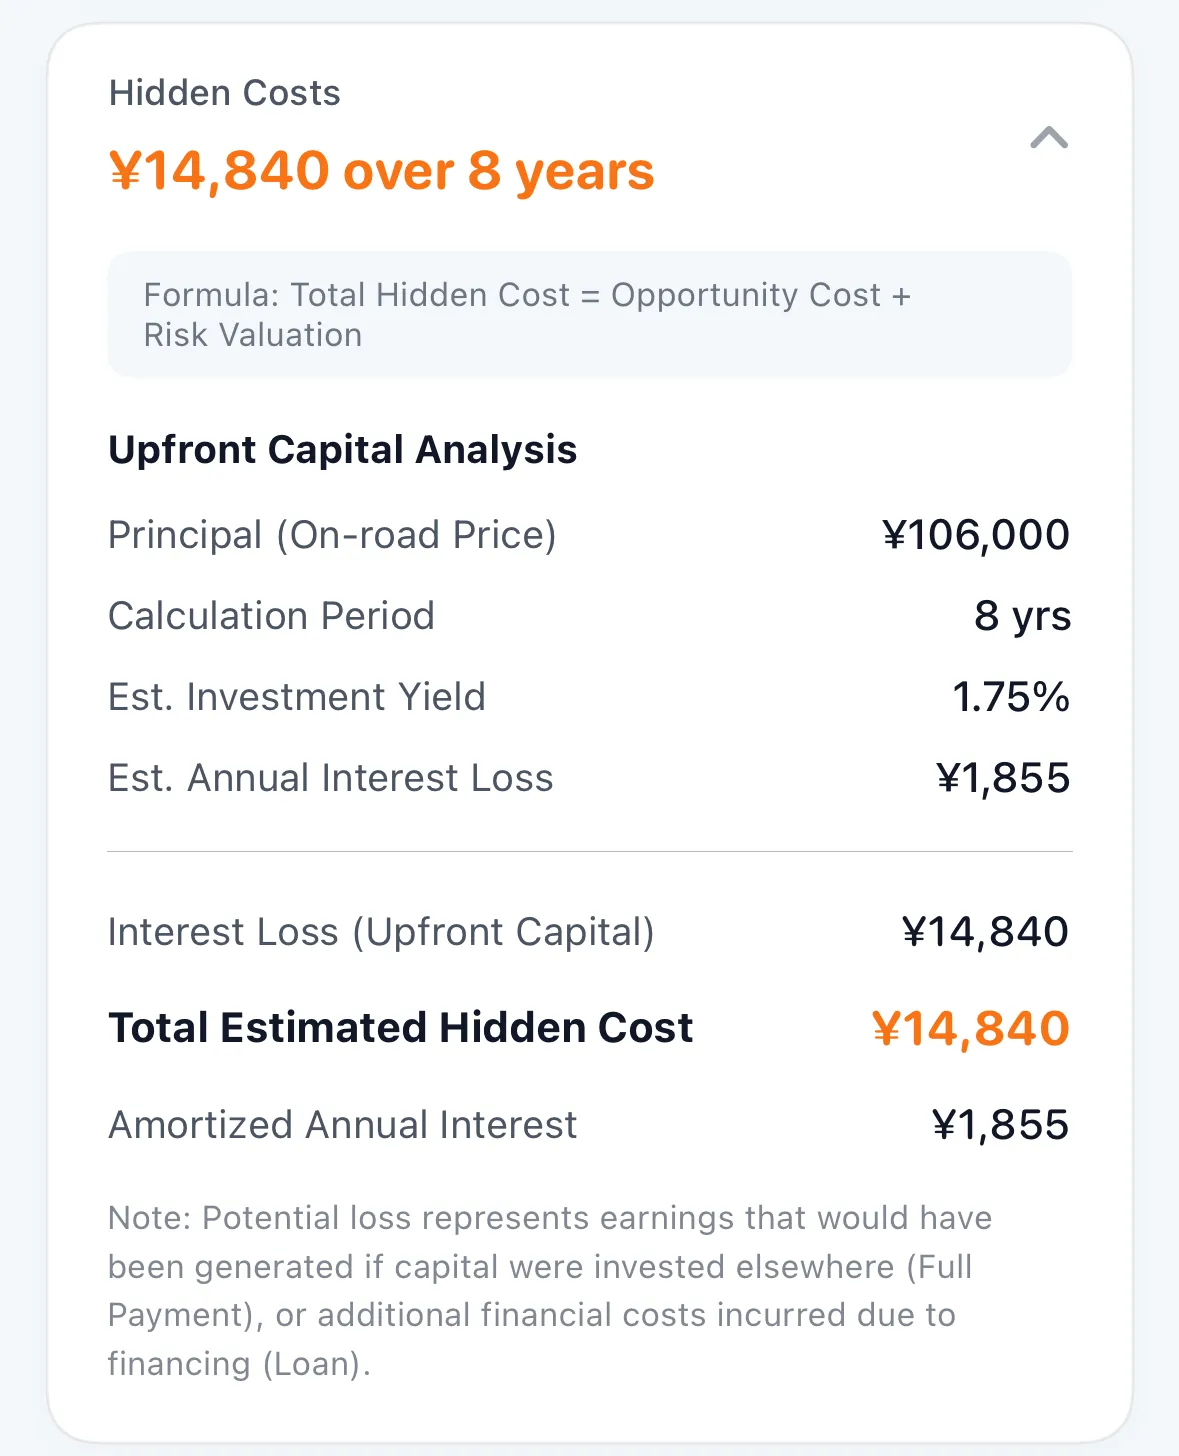
- Cash Purchase Opportunity Cost: If you purchase in cash, those funds are diverted from low-risk yield investments (e.g., treasury bonds or high-yield savings earning 2%–4% annually). Buying a car means foregoing these compounding earnings—TrueCostAuto attributes this opportunity loss directly to ownership;
- Financing Loan Interest: For financed purchases, cumulative loan interest paid to lending institutions based on borrowed principal, loan duration, and APR;
- Annual Amortization: Displays total lifetime interest forgone and annual amortized cost.
6. Real-World Consumption & Efficiency Analysis
Moving beyond manufacturer laboratory test conditions, TrueCostAuto evaluates real-world driving efficiency:
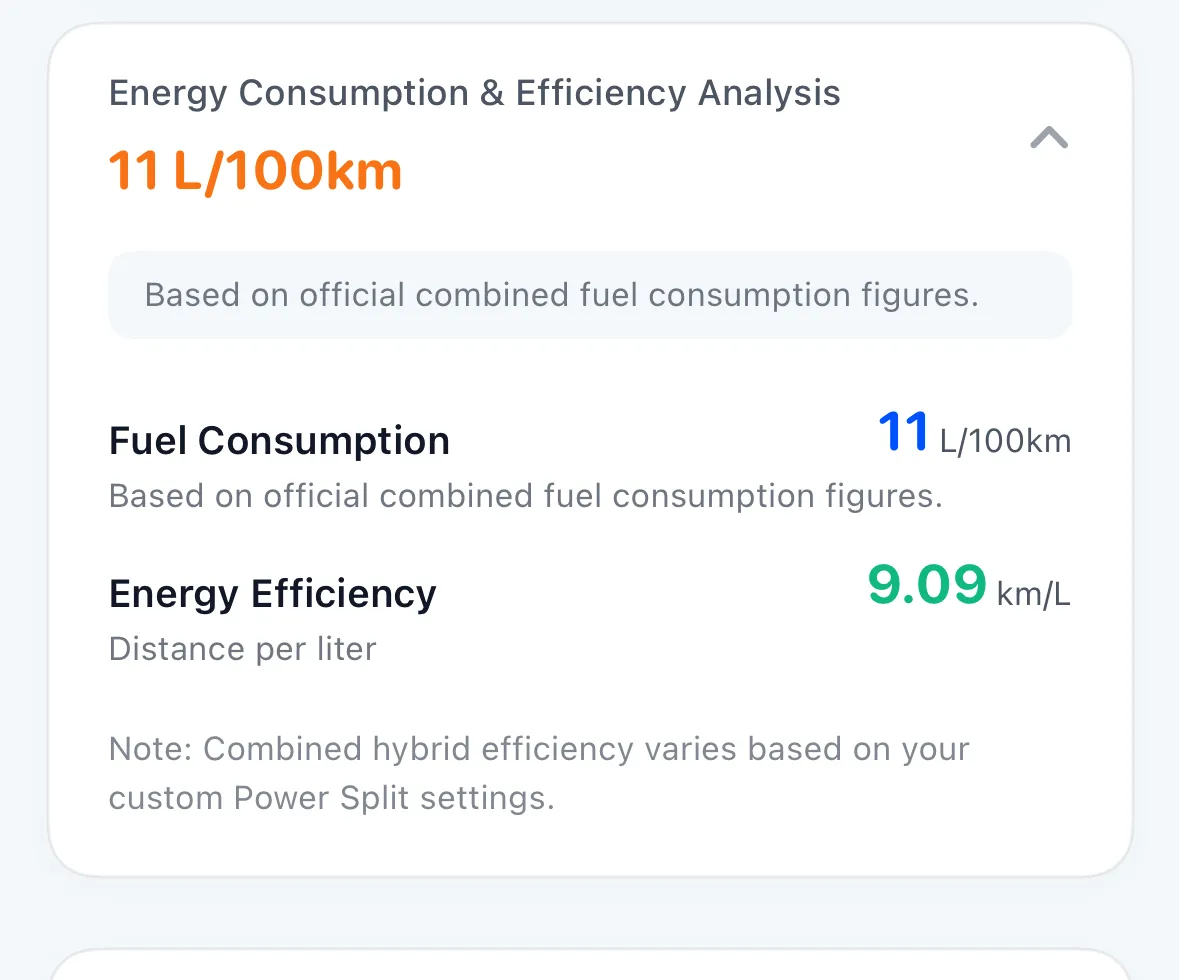
- Real-World Consumption: Displays combined fuel economy (e.g.,
8.2 L/100kmor28.7 MPG) or electric consumption (e.g.,16.5 kWh/100kmor3.76 mi/kWh); - Energy Conversion Efficiency: Measures distance covered per unit of energy (e.g.,
12.2 km/Lor6.06 km/kWh), enabling transparent cross-powertrain benchmarking; - Plug-in Hybrid Blending: Accurately fuses dual electric and gasoline ratings based on your specified commuting ratio.
7. Subjective Trade-offs & Annual Expenditure Breakdown
Rational car buying balances objective numbers with personal satisfaction and balanced financial structure:
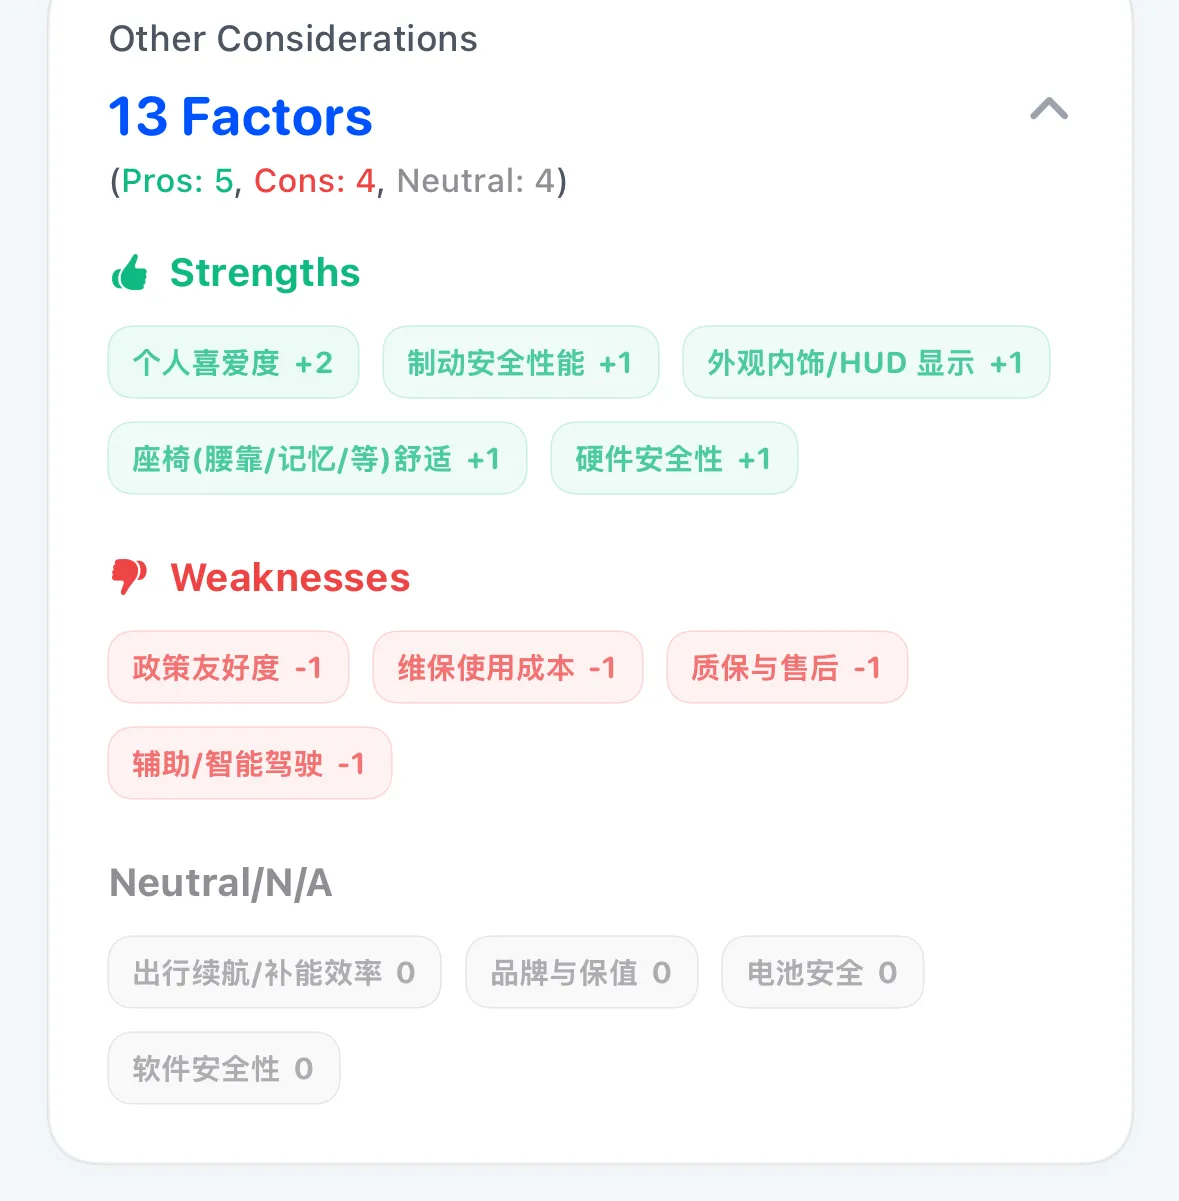
- 13 Subjective Factor Audit: Summarizes personal ratings across Strengths, Weaknesses, and Neutral factors (e.g., acoustic quietness, throttle response, cabin utility);
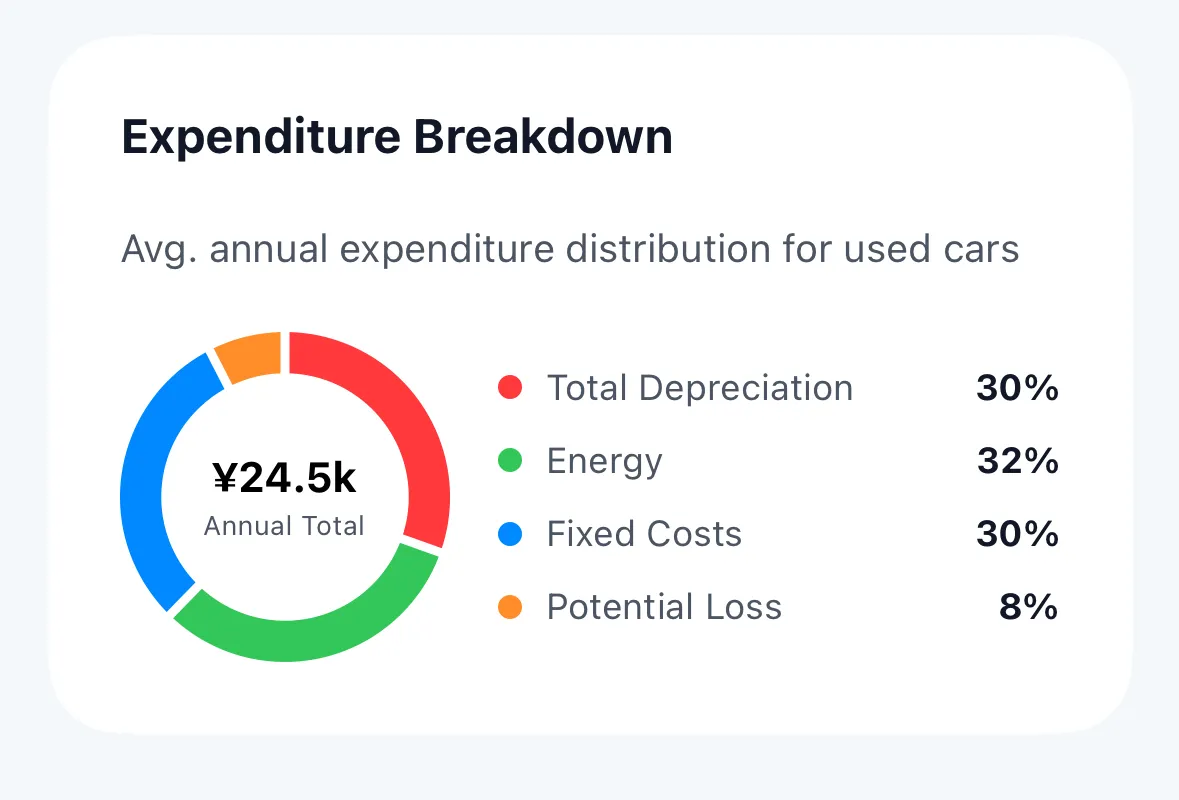
- Annual Expenditure Distribution Donut Chart:
- Depreciation: e.g., 30% of total outlay;
- Energy & Fuel: e.g., 32%;
- Fixed Operating Costs: Insurance, servicing, and tolls at 30%;
- Hidden Opportunity Loss: Capital cost at 8%;
- Instantly reveals where your money actually flows, facilitating targeted budgeting adjustments.
8. 5-Dimensional Health Radar & Optimal Replacement Timing
At the base of the report, TrueCostAuto delivers an executive health audit and strategic timing recommendation:
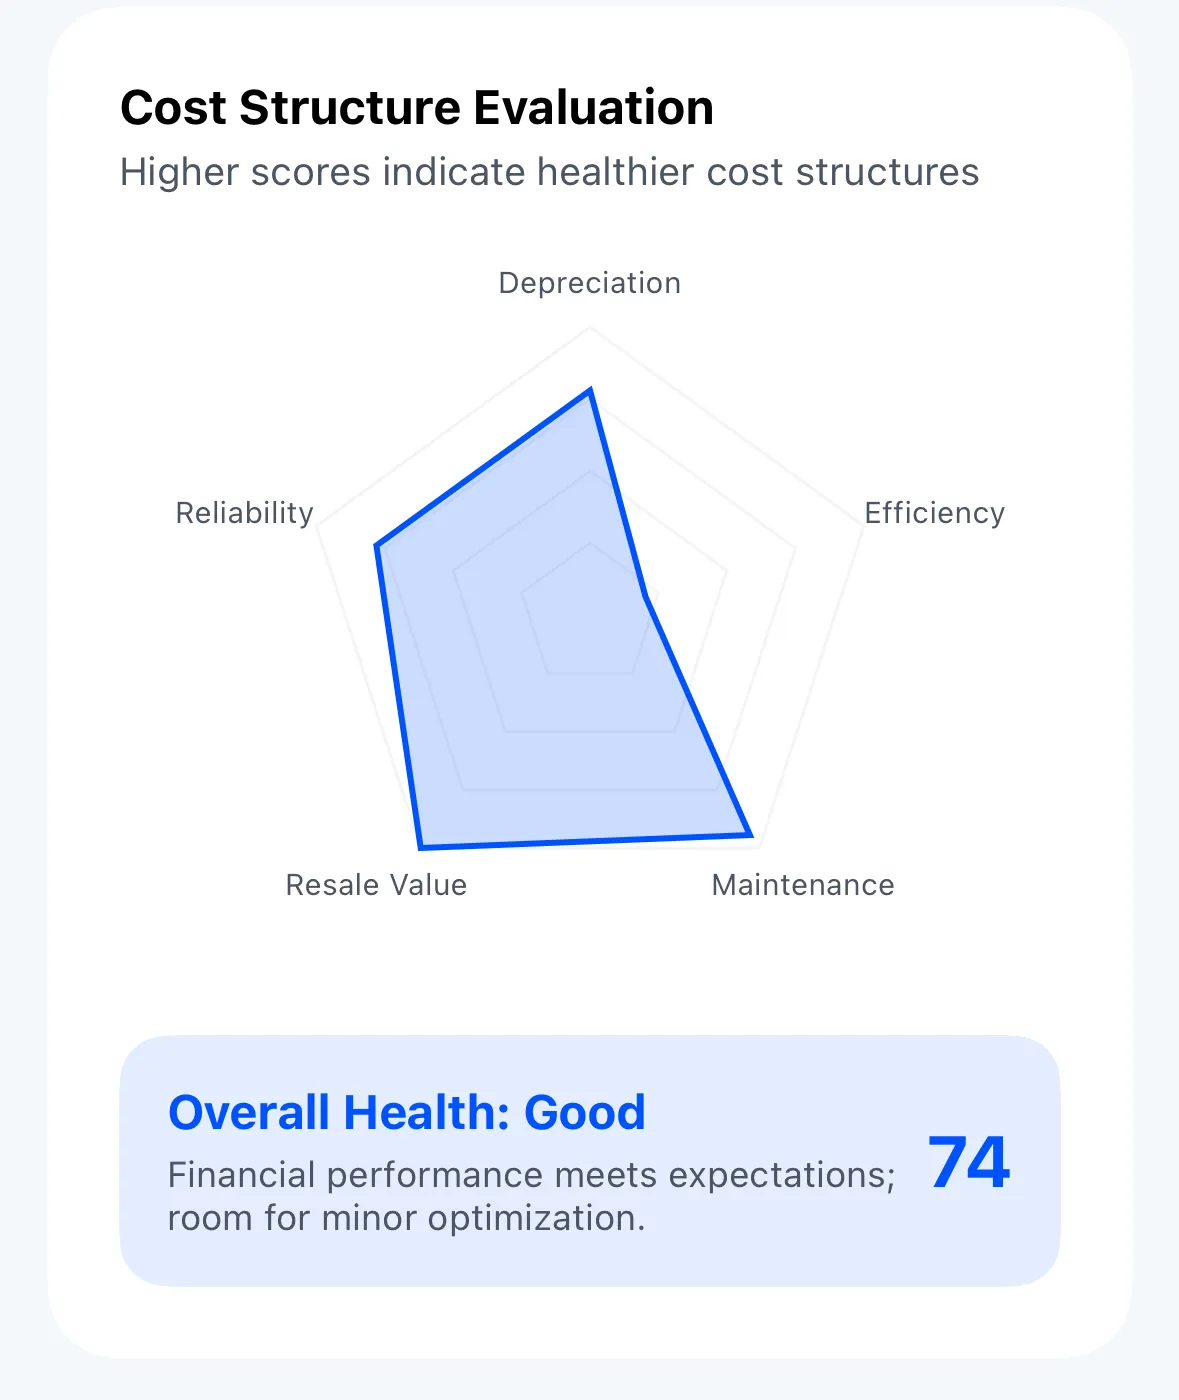
8.1 5-Dimensional Health Radar (Cost Structure Evaluation)
Evaluates the vehicle across Depreciation Control, Reliability & Durability, Energy Efficiency, Maintenance Burden, and Resale Value Retention, culminating in an aggregate grade (e.g., 74 / Good).
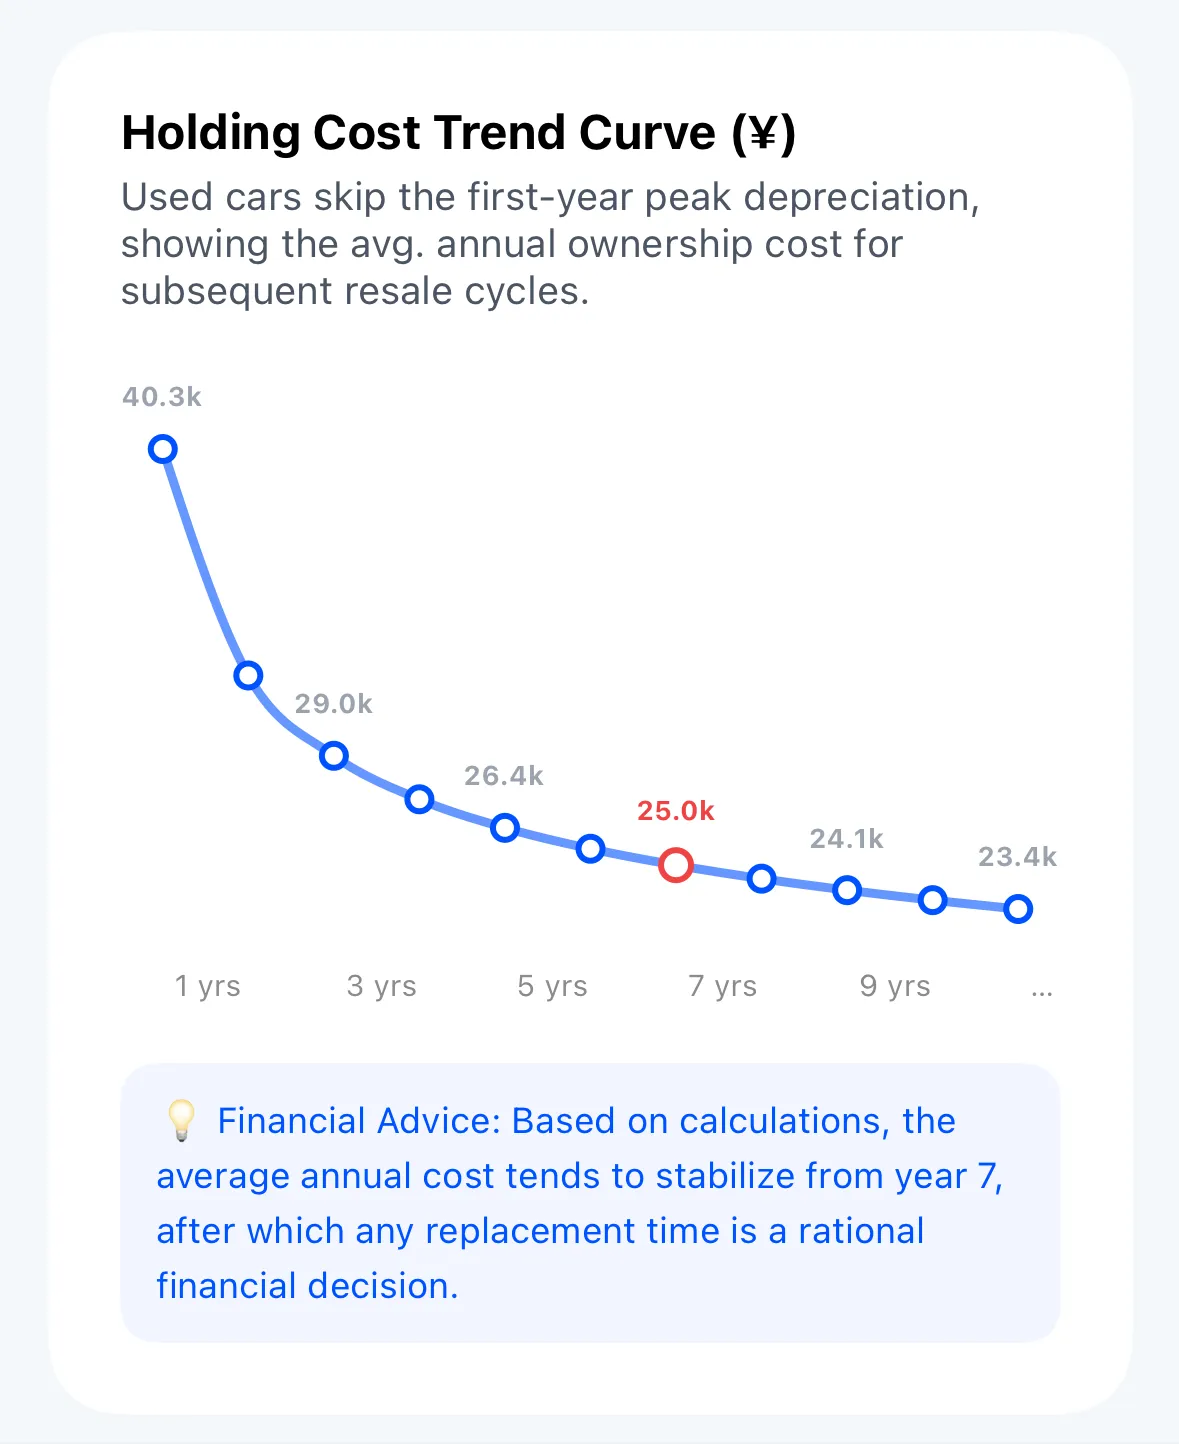
8.2 Ownership Duration Curve & Optimal Replacement Window
- Annualized Cost Trajectory (Years 1–9): Demonstrates the downward amortization curve of annual costs (e.g., softening from
$6,800/yrin Year 1 to$4,600/yrby Year 7); - Optimal Replacement Timing (Financial Advice): Identifies the mathematical inflection point where annual depreciation stabilizes into a plateau, highlighting your golden window to upgrade or sell.
Ready to compare multiple candidate models side by side? Continue to 04. Vehicle Comparison & Decision Analysis.