

⚖️ 04. Vehicle Comparison & Decision Analysis (Vehicle Comparison)
Compare multiple shortlisted vehicles side by side to identify the most cost-effective and personally satisfying choice.
Car buying is not just about choosing the cheapest option—it is about honoring your lifestyle preferences. This guide demonstrates how to leverage TrueCostAuto’s multi-vehicle comparison arena, proprietary PRS scoring, custom factors, and mileage breakeven curves.
📑 In This Guide
- Multi-Vehicle Comparison Overview (PK)
- Proprietary PRS Scoring and Star Rankings
- 65+ Metric Evaluation Matrix and Custom Factors
- Mileage vs. Annual Cost Sensitivity (Finding the Breakeven Point)
- Mileage vs. Lifetime Cumulative TCO Sensitivity
- Stacked Cost Component Bar Charts by Mileage
- One-Click High-Resolution Summary Export
1. Multi-Vehicle Comparison Overview (PK)
Navigate to the Compare tab to select multiple shortlisted vehicles saved in your garage for side-by-side evaluation:
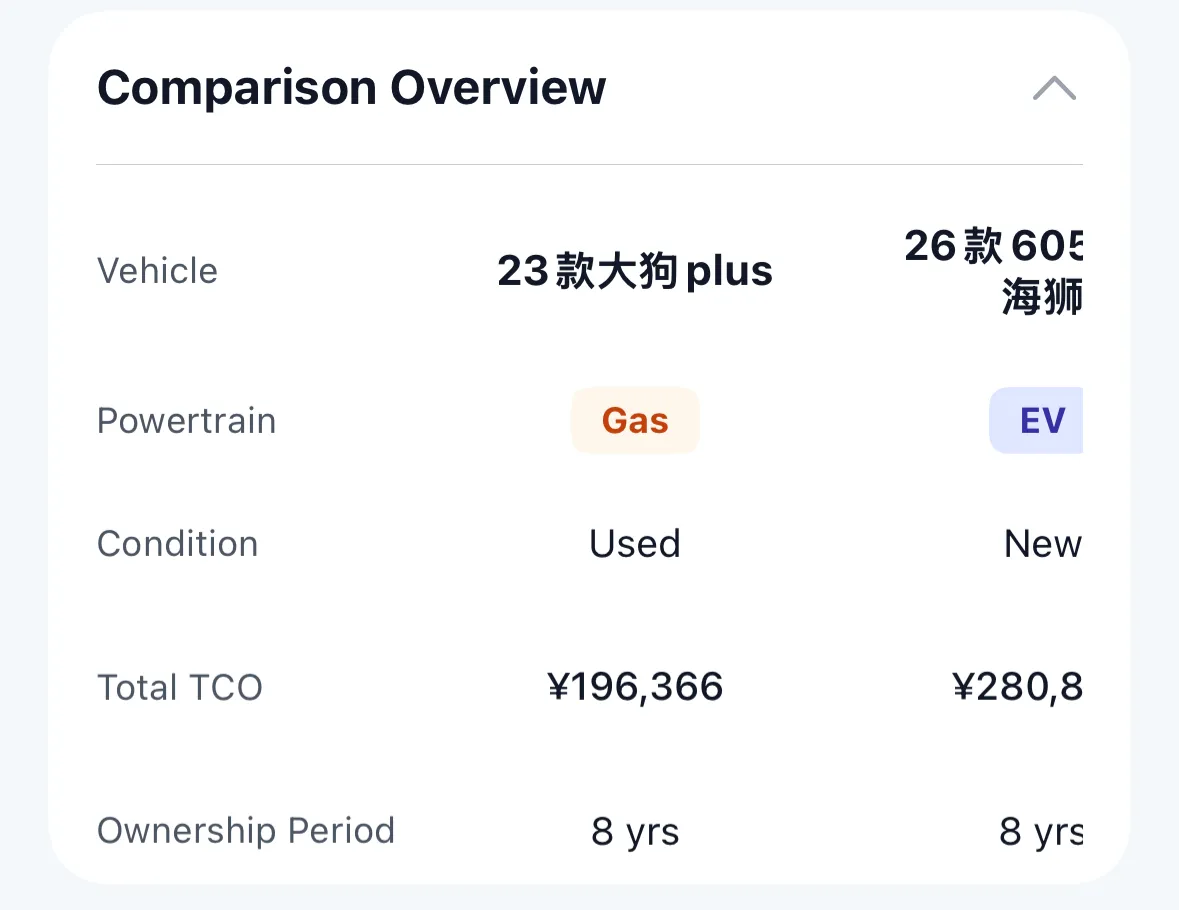
- Side-by-Side Metric Alignment: Directly compares powertrain types (Gas, EV, Hybrid/PHEV), condition (New vs. Used), Total TCO, and planned ownership duration;
- Edition Capabilities: The Free edition allows 2 vehicles to compete head-to-head. The Pro edition expands capacity to multi-vehicle rosters, automatically sorting candidates into a tiered ranking hierarchy.
2. Proprietary PRS Scoring and Star Rankings
If buying decisions were made solely by an accountant, everyone would drive the cheapest subcompact econobox. In reality, cars represent safety, lifestyle convenience, driving pleasure, and personal taste.
TrueCostAuto features a proprietary Purchase Recommendability Score (PRS), weighing subjective personal delight against objective financial expenditure:
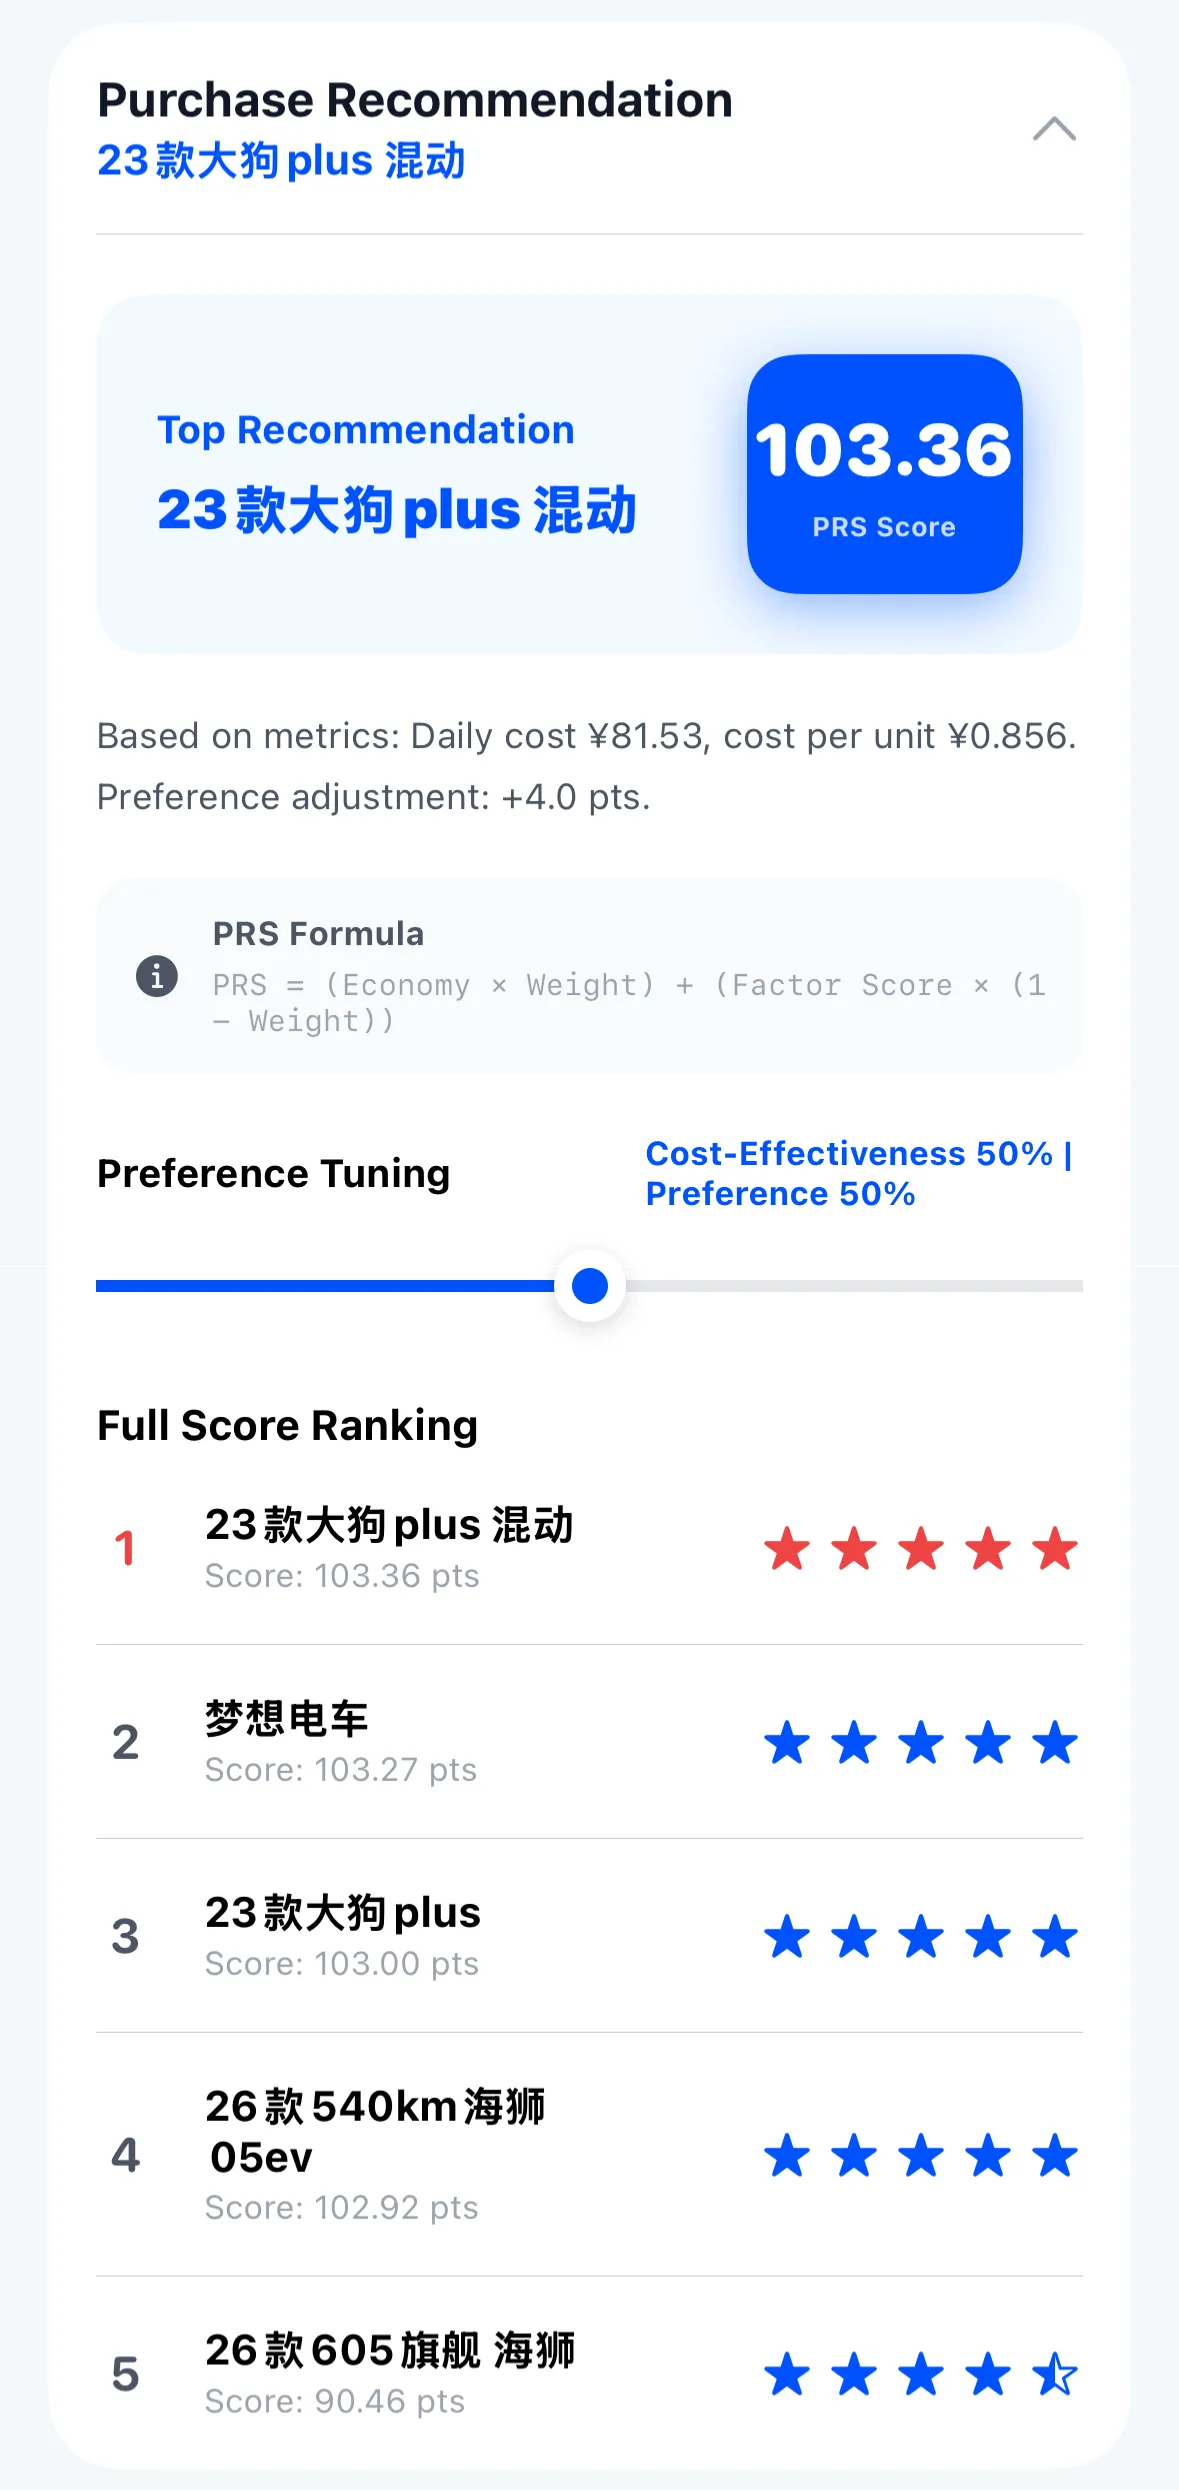
2.1 PRS Core Calculation Formula
- Top 1 Intelligent Recommendation: Combines daily cost, per-mile/km expenses, and subjective ratings to recommend the top overall candidate (e.g.,
2023 Hybrid Crossover, Score 103.4 pts); - Preference Tuning Slider: Freely adjust the slider to reflect your decision-making posture:
- Cost-Effectiveness Focus: Rational mindset where financial economy carries heavier weighting;
- Personal Preference Focus: Quality and driving enjoyment take priority, accepting higher operating expenses for greater satisfaction;
- Balanced Mode (50% : 50%): Default recommendation, offering an equal balance between budget discipline and premium features.
- Full Star Rankings: Shortlisted vehicles are ranked from highest to lowest composite score with star tier badges and detailed ratings.
3. 65+ Metric Evaluation Matrix and Custom Factors
Smart car buying requires meticulous scrutiny of fine details:
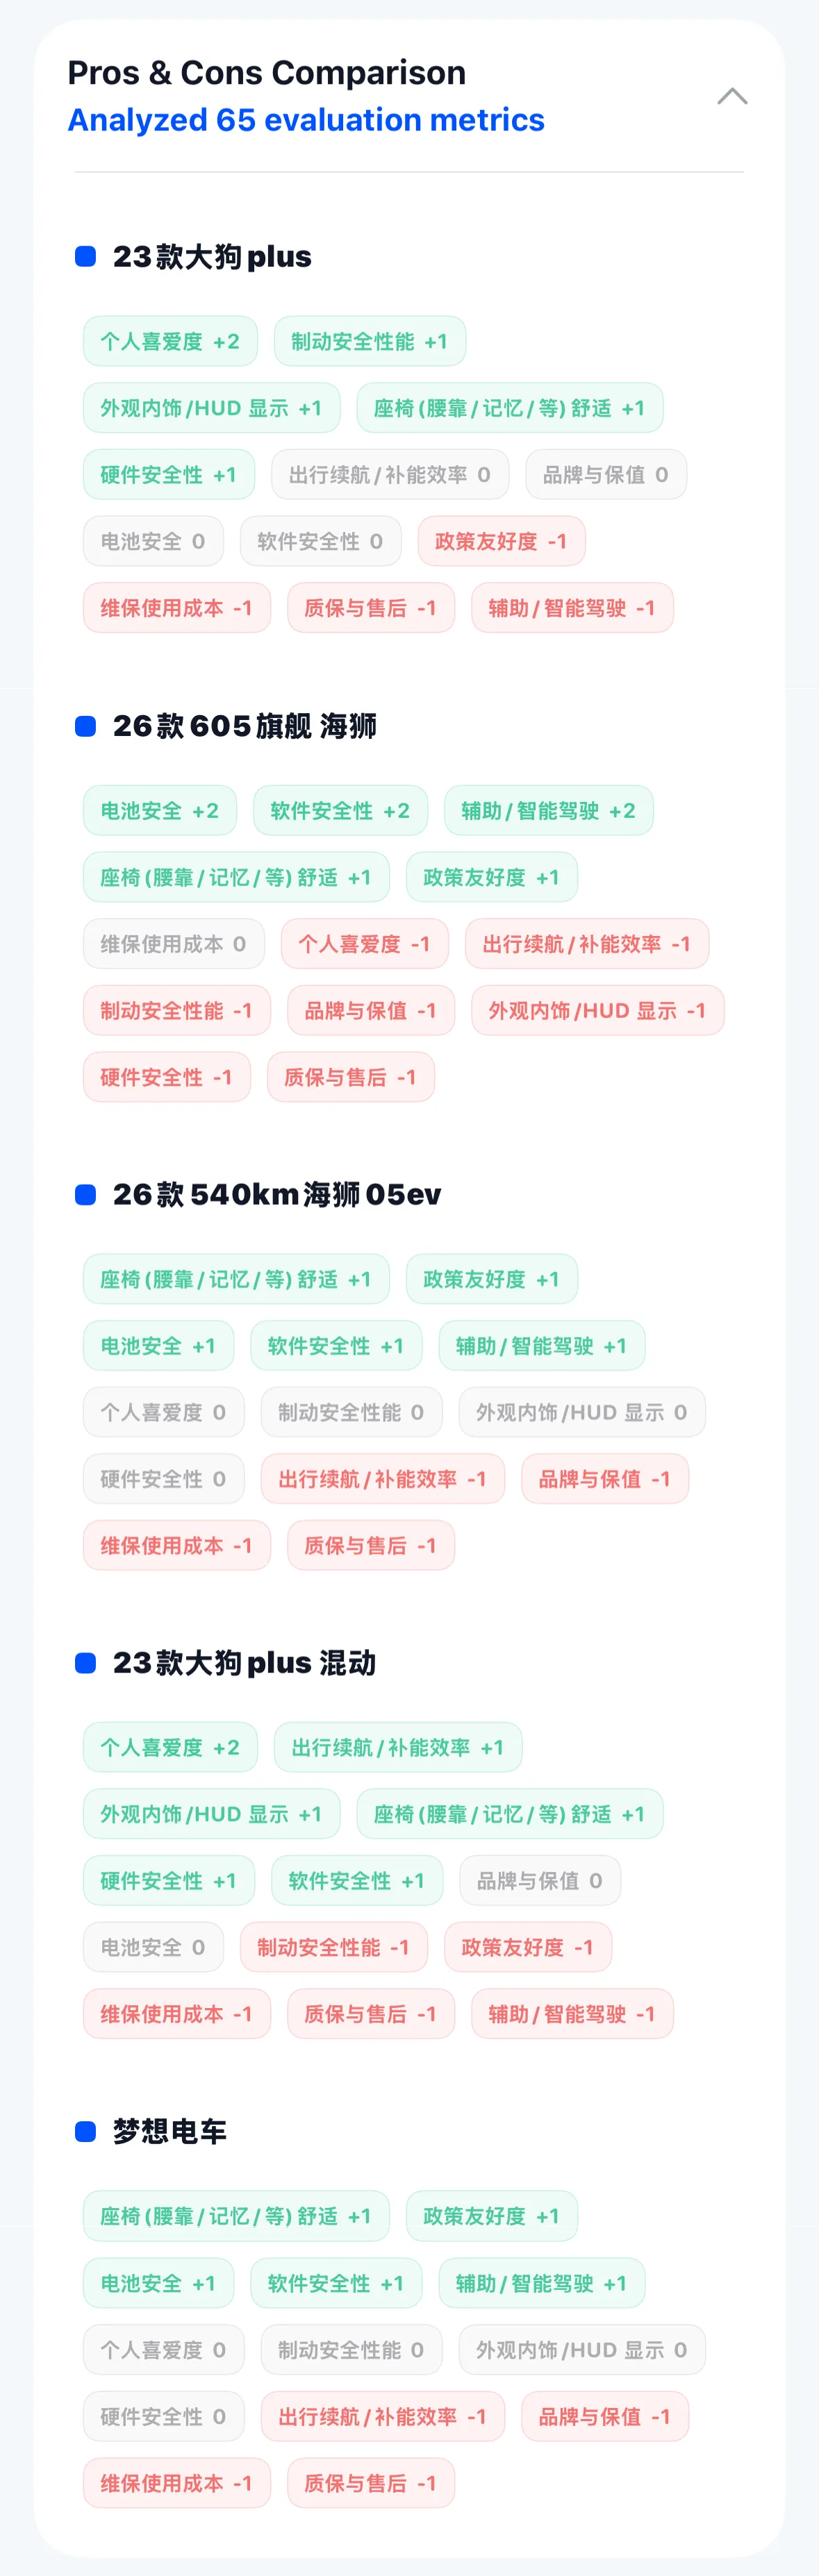
3.1 65 Multi-Dimensional Evaluation Factors (Pros & Cons)
Preconfigured assessment criteria span safety, ergonomic comfort, intelligent driving, charging, and ownership peace of mind:
- Safety Assurance: Battery pack integrity, crash test ratings, active braking, and software robustness;
- Cabin Comfort: Seat ergonomics (lumbar support, memory, heating/ventilation), HUD, and interior styling;
- Daily Usability: Cold-weather range, fast-charging speed, driver assistance, maintenance cost, warranty coverage, and brand resale strength;
- Tier Badges: Scores are color-coded (Green
+2 / +1indicates distinct advantages, Gray0neutral, Red-1 / -2known shortcomings).
💡 Add Your Own Custom Factors
You are not limited to pre-configured metrics—easily create custom factors tailored to your lifestyle!
Examples:
- Family Needs: Ease of ISOFIX child-seat installation, double stroller trunk clearance;
- Outdoor & Camping: Vehicle-to-Load (V2L) discharge wattage, roof rack load rating;
- Personal Quirks: Physical tactile buttons vs. touchscreen-only, premium audio tuning, pet-friendly scratch-resistant leather.
Custom factors undergo identical mathematical normalization and weighting within the PRS model.
4. Mileage vs. Annual Cost Sensitivity (Finding the Breakeven Point)
This is the most decisive chart when comparing Electric Vehicles to Internal Combustion models. Prospective buyers often ask: “An EV costs several thousand dollars more upfront; will my driving habits save enough on fuel to recoup that premium?”
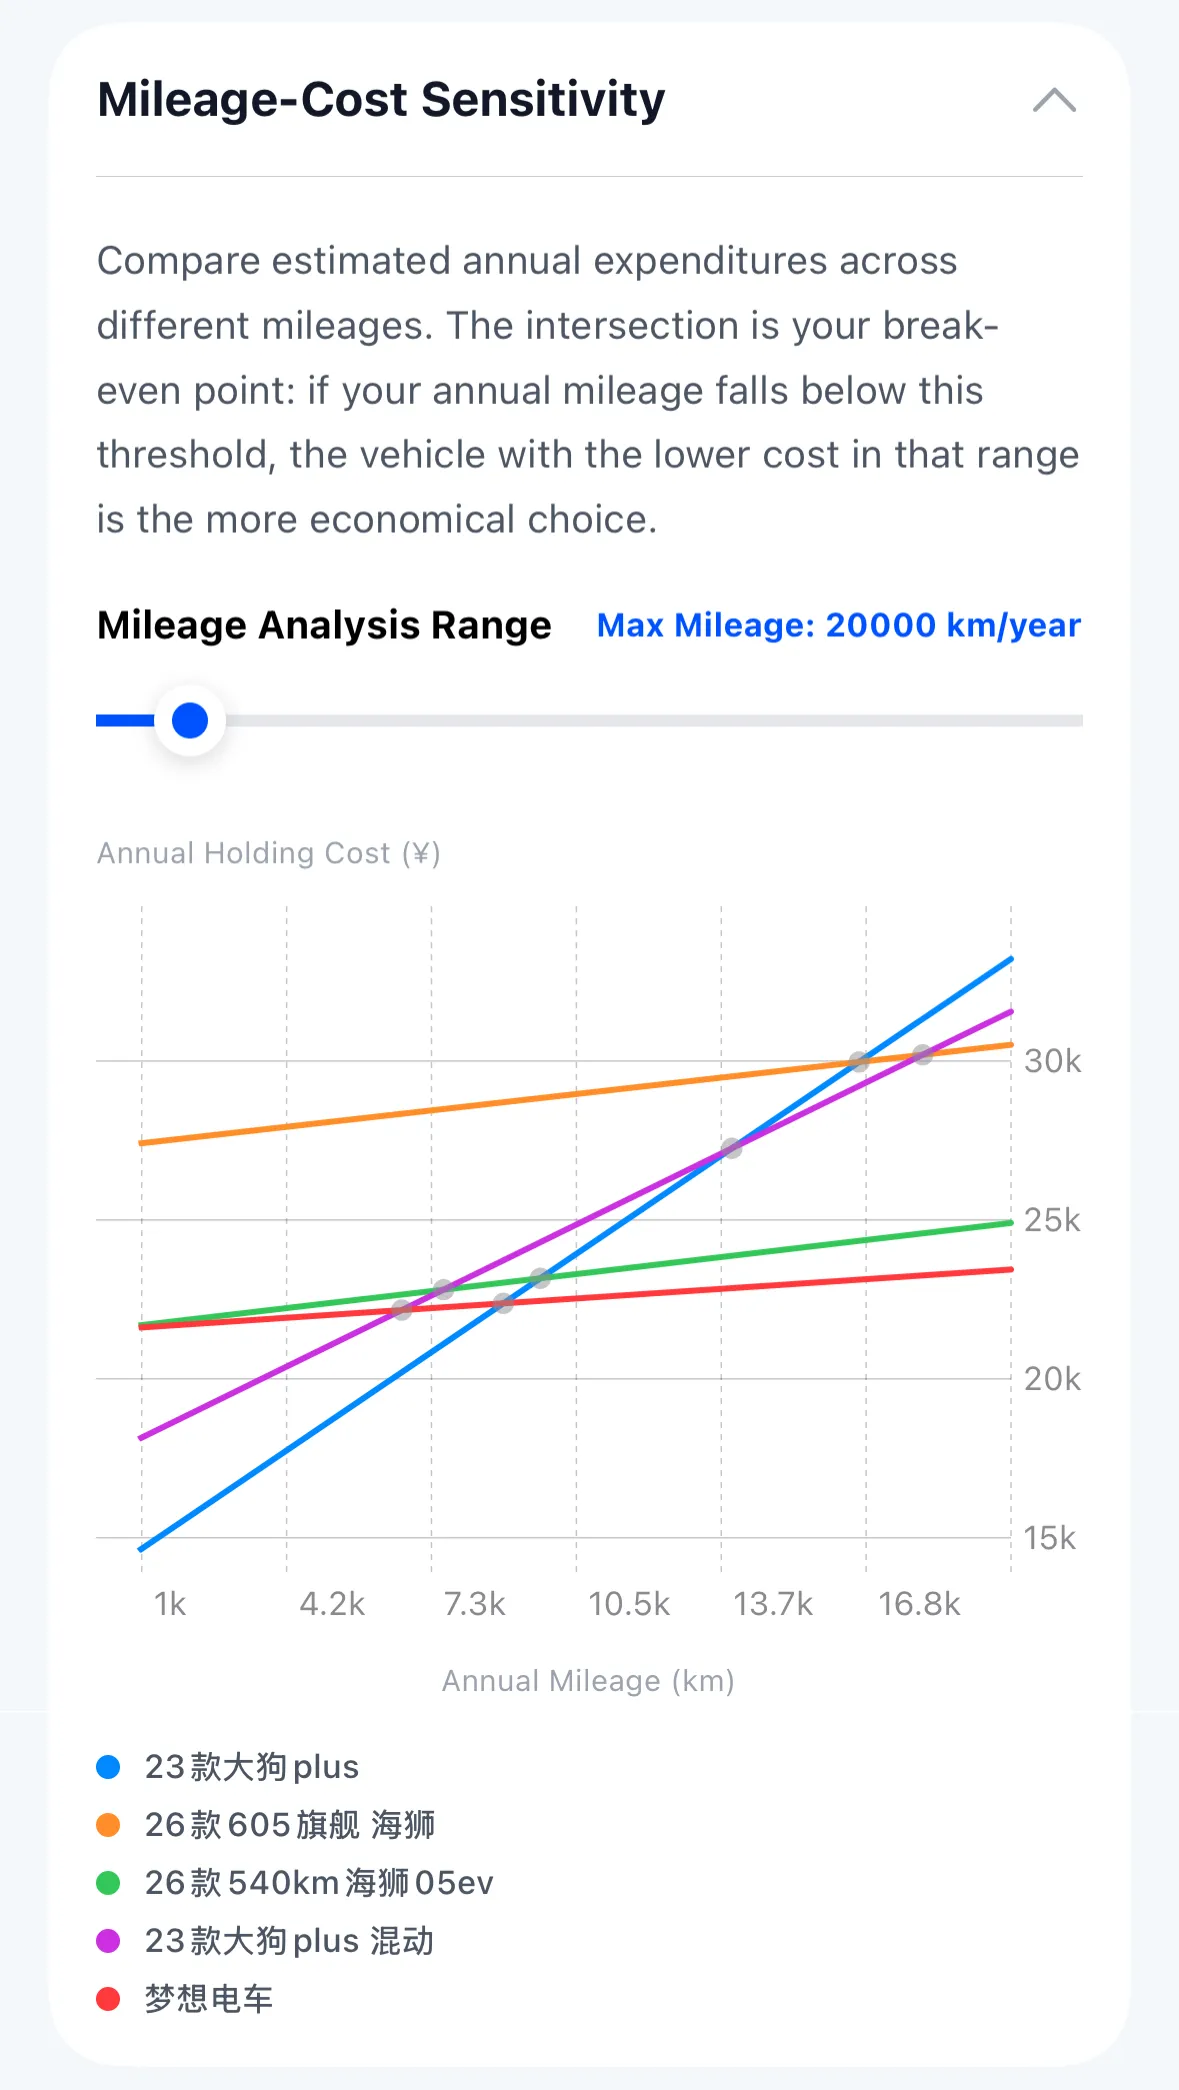
- The Intersection is Your “Breakeven Point”:
- The gas car’s line starts lower (cheaper initial purchase) but rises sharply with mileage due to higher fuel costs (steeper slope);
- The EV or PHEV curve starts slightly higher but flattens out due to ultra-low electricity costs per mile;
- Where the curves intersect marks your financial breakeven mileage: If your annual driving exceeds the intersection, the energy-efficient car will repay its premium. If your annual mileage sits below the intersection, the lower-priced gas vehicle remains financially superior;
- Dynamic Slider: Drag the annual mileage slider (e.g., from 1k to 30k mi/year or km/year) to observe cost curves crossing in real time.
5. Mileage vs. Lifetime Cumulative TCO Sensitivity
Extending beyond single-year budgets, the system projects the full multi-year ownership lifecycle (e.g., across 8 complete years):
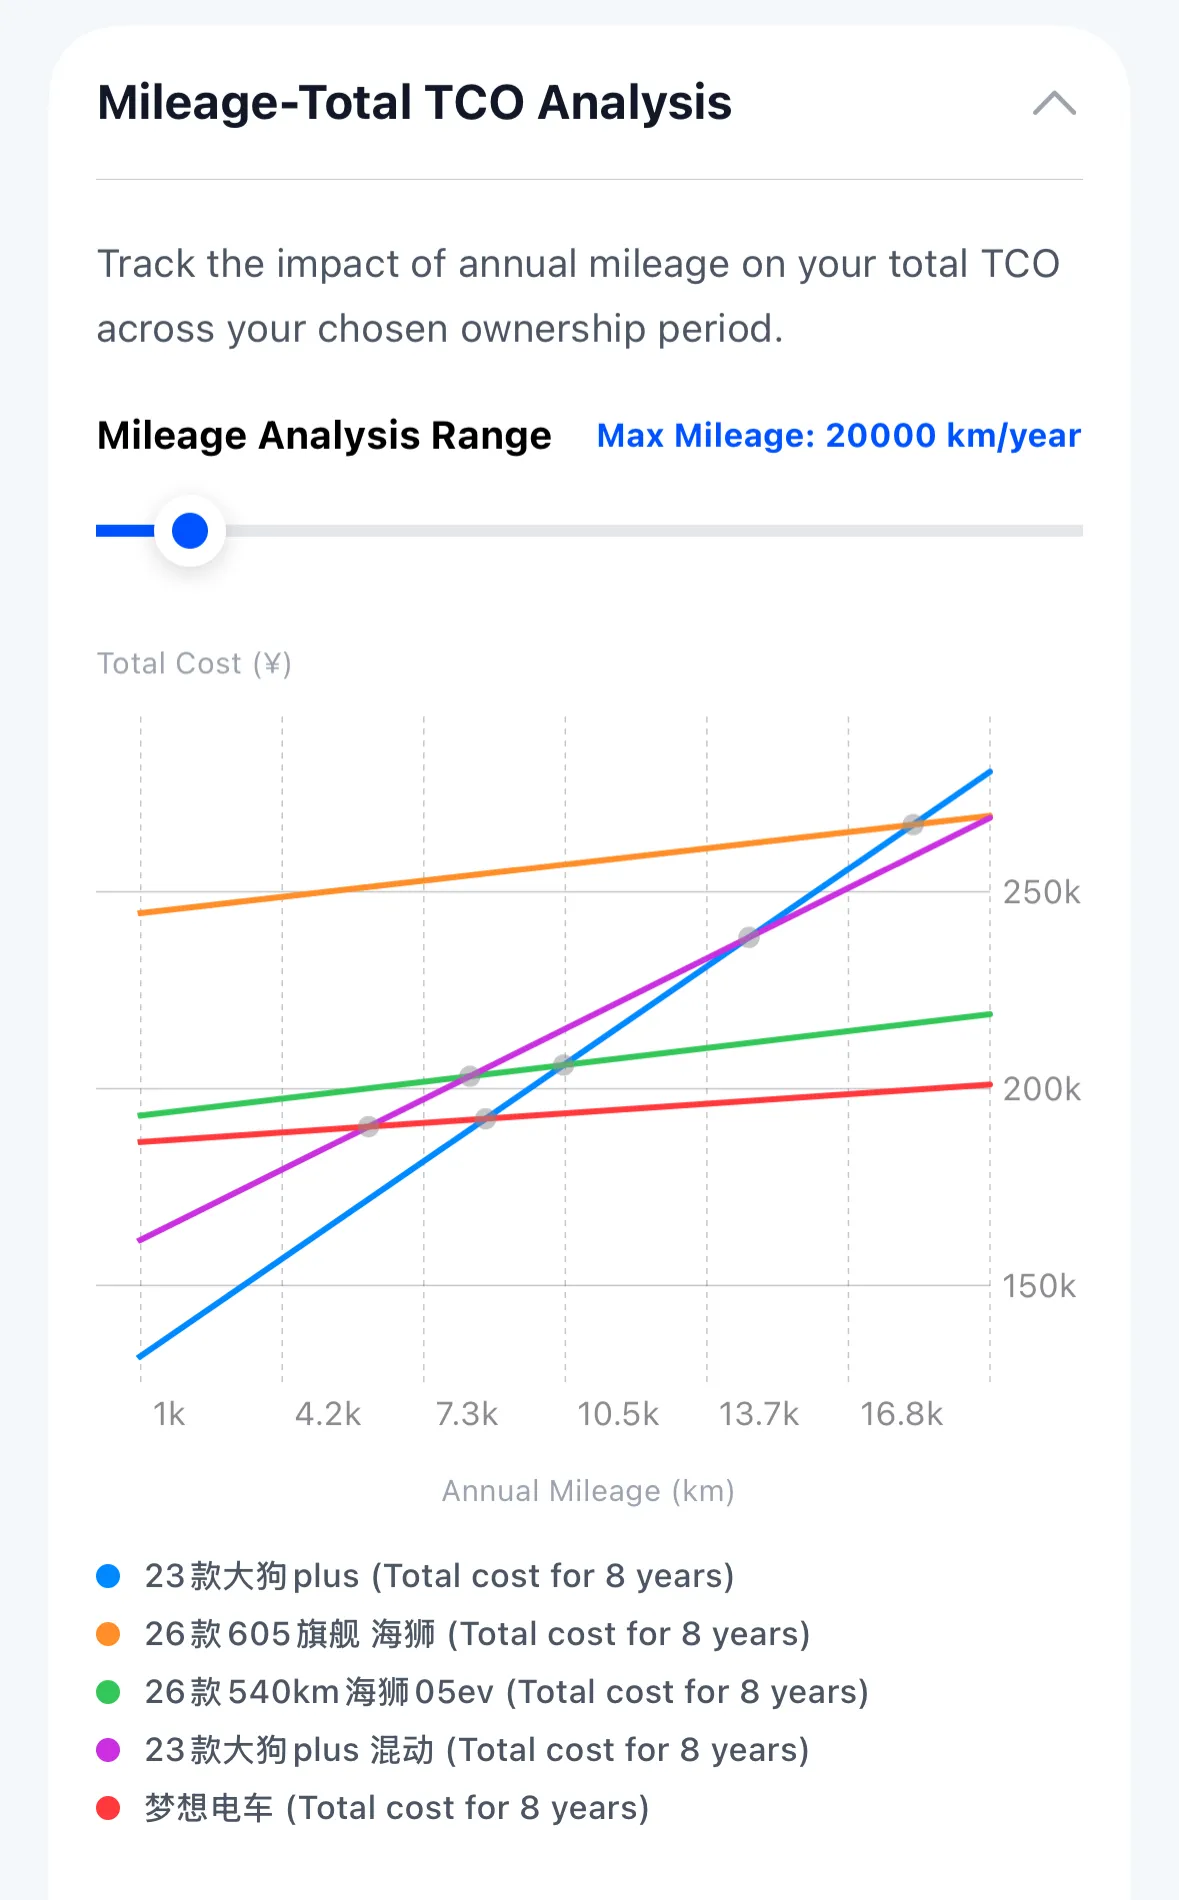
- Long-Term Compounding: Demonstrates how annual mileage compounding over 8 years amplifies the total TCO gap;
- Macro Planning Guidance: Distinguishes whether “accumulated fuel savings will comfortably overcome EV depreciation” or “low annual driving causes time-based depreciation to dwarf energy savings”.
6. Stacked Cost Component Bar Charts by Mileage
At any representative mileage point (e.g., 15,000 mi or 20,000 km per year), TrueCostAuto renders a stacked color bar chart dissecting exactly where your money goes:
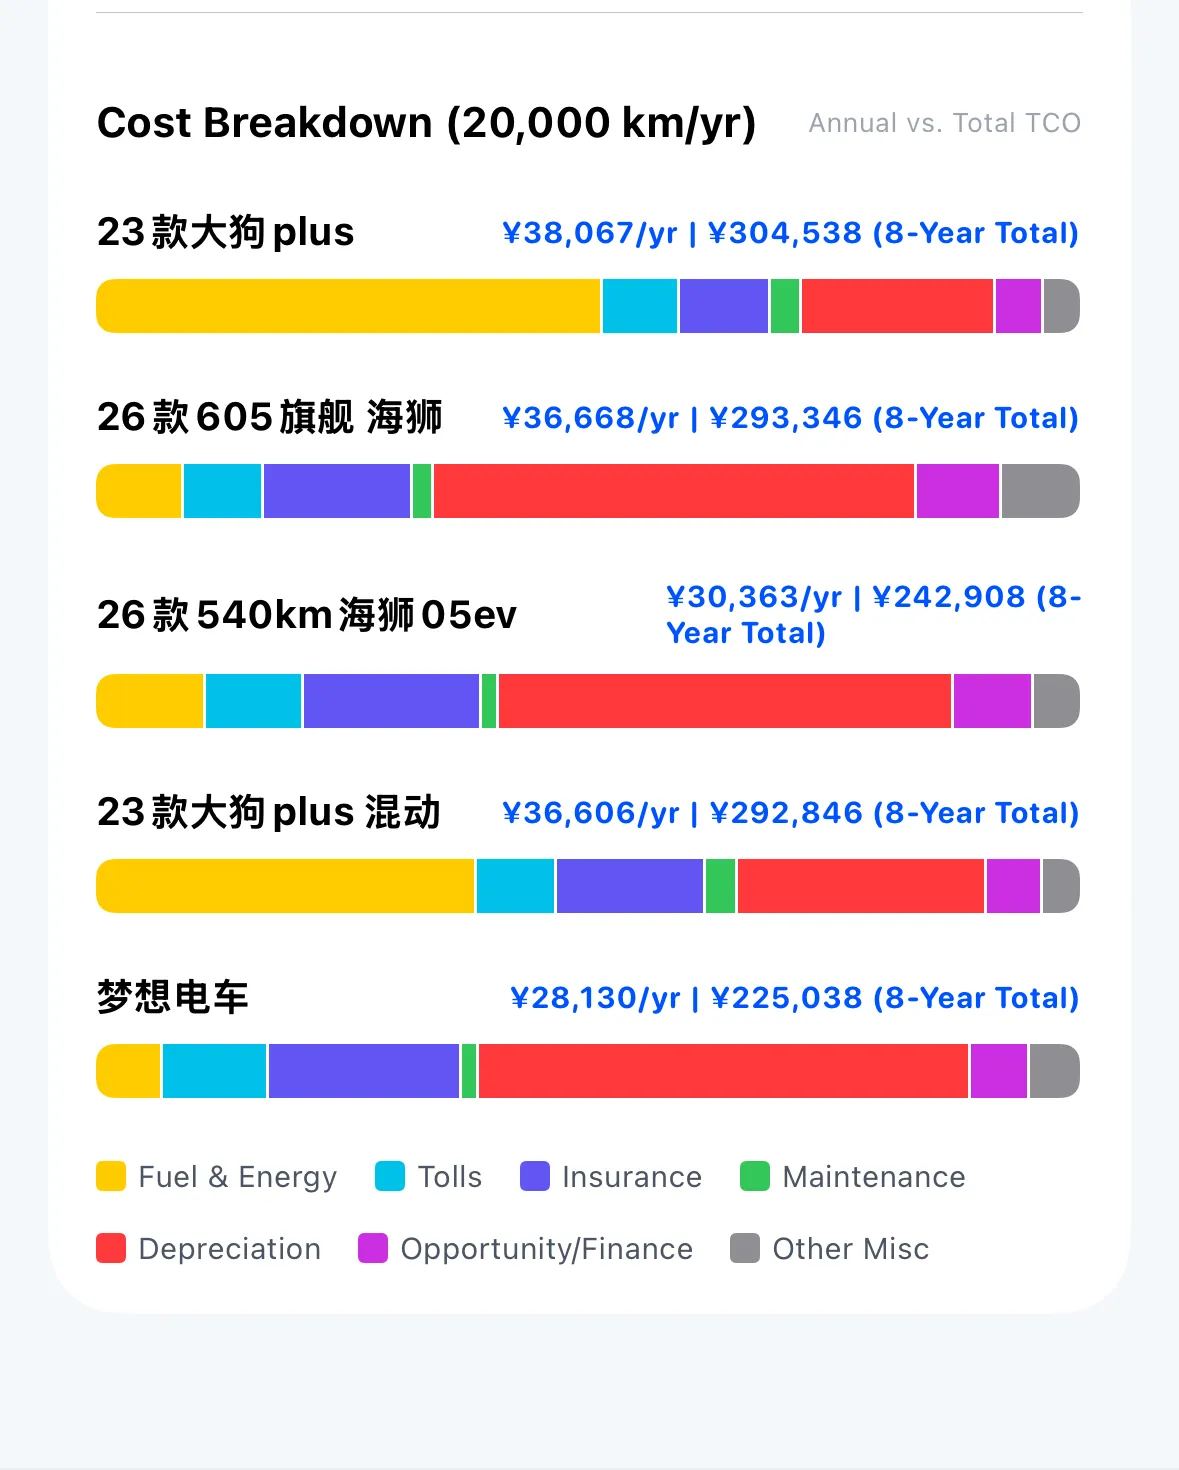
- Side-by-Side Expenditure Comparison: Directly compares Annualized Cost (e.g.,
$5,600/yrvs.$4,100/yr) and Lifetime Outlay (e.g.,$44,800vs.$32,800); - Six Color-Coded Component Blocks:
- 🟡 Fuel & Energy (Fuel & Energy)
- 🔵 Vehicle Depreciation (Depreciation)
- 🟣 Highway Tolls & Insurance (Tolls & Insurance)
- 🔴 Opportunity Costs & Financing Interest (Opportunity/Finance)
- 🟢 Routine Maintenance & Wear Items (Maintenance)
- ⚪ Miscellaneous & Parking (Other Misc)
- Spot immediately whether depreciation, fuel, or insurance is the primary wallet-drainer.
7. One-Click High-Resolution Summary Export
Purchasing a vehicle is often a family or shared decision:
- Tap the Share / Export icon at the top of the comparison screen;
- The app collapses unnecessary white space to render a crystal-clear vertical infographic;
- The exported image includes the comparison overview, PRS rankings, Pros & Cons matrix, sensitivity curves, and cost bar charts, accompanied by QR verification codes for seamless messaging and consultation.
Having explored vehicle comparisons, learn how to configure regional tax and energy baselines in 05. Regional Presets & Preferences.